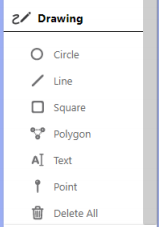
Use the Drawing tools to add visual data to the map. A pop-up box is displayed when a Drawing tool is selected where you can modify the color or thickness, and select which labels are displayed on the map.
![]() Tip:
Tip:
Hold Ctrl while using a Drawing tool to snap to an object on the map.
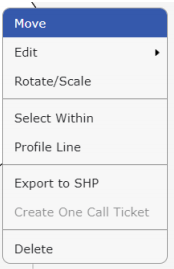
Right click a drawing or a label on the map to modify it, select the objects within a drawing (Select Within), or view the Profile Line of a drawing:
![]() Tip:
Tip:
After you have added drawings or labels to a map, you will likely want to save, share, or print it. Refer to Save, Share and Export Maps